Long story short: Discover Two-wheeler Company-wise Market Share in India in FY24-25 with in-depth industry analysis, EV trends, sales growth, and company performance insights in detail.
India’s two-wheeler market isn’t just about numbers—it’s a window into how people in India move, work, and adapt to change. Over the past few years, we’ve seen a real shift. For instance, more people are moving to cities, government rules are evolving, and electric scooters and bikes are becoming a common sight on the roads. As a result, these changes aren’t just shaping what people ride, but also how companies think about the future.
This report breaks down which companies are gaining or losing ground in the two-wheeler market and, more importantly, explains why. Specifically, by looking at sales numbers, what’s driving people’s choices, and how companies are responding, we aim to give clear, useful insights for anyone interested in how India’s two-wheeler scene is changing—from industry experts to everyday riders.
Key Takeaways
- Honda’s Market Surge: Honda (HMSI) achieved the largest market share gain among major OEMs, driven by strong scooter sales, network expansion, and technology leadership, overtaking several competitors in key urban segments.
- TVS and Bajaj’s EV Momentum: TVS Motor and Bajaj Auto capitalised on early electric vehicle leadership, with TVS iQube and Bajaj Chetak outperforming several EV-only startups, signalling a shift in industry power towards legacy brands with EV capabilities.
- Exports Drive Stability: Bajaj Auto and TVS Motor’s robust export strategies helped insulate them from domestic market volatility, with exports contributing significantly to their overall growth and market share stability.
- Scooter Segment Transformation: The scooter segment saw rapid growth (17.4% YoY), benefiting Honda, TVS, and Suzuki, and underscoring shifting consumer preferences towards urban mobility solutions.
- Hero Under Pressure: Despite retaining leadership, Hero MotoCorp faced market share erosion due to slower growth in scooters and electric vehicles, emphasising the need for diversification and accelerated innovation.
Industry Overview: FY 2024-25 Performance
1. Total Market Size and Growth
India’s two-wheeler market bounced back strongly in FY 2024-25, according to the Society of Indian Automobile Manufacturers (SIAM). Consequently, this rebound signals renewed momentum in the industry.
| Metric | FY 2023-24 | FY 2024-25 | Absolute Change | YoY Growth |
|---|---|---|---|---|
| Total 2W Domestic Sales | 1,79,74,365 units | 1,96,07,332 units | +16,32,967 units | 9.1% |
| Scooters | 58,39,325 units | 68,53,214 units | +10,13,889 units | 17.4% |
| Motorcycles | 1,16,53,237 units | 1,22,52,305 units | +5,99,068 units | 5.1% |
| Electric 2-Wheelers | 9,48,561 units | 11,49,334 units | +2,00,773 units | 21.0% |
Table 1: India Two-Wheeler Sales by Segment – FY23-24 vs FY24-25
Key Observations
- Recovery Momentum: Industry nears its pre-COVID peak of 2.12 crore units from FY 2018-19.
- Scooter Surge: Scooters grew 17.4%, outpacing motorcycles (5.1%) and mopeds (4.2%).
- Electric Revolution: Electric two-wheelers reached 5.86% market share, up from about 5% last year.
- Export Boom: Exports grew 21.4% to about 42 lakh units, led by demand in Africa and Latin America.
2. Segment-Wise Market Dynamics
Meanwhile, shifts in consumer preferences were clear in the performance of each segment:
- Scooters contributed over 62% of the absolute volume increase, despite comprising 35% of total sales.
- Scooter growth corresponds to urbanisation trends and gradual improvement in semi-urban connectivity.
- Motorcycles maintained 62.5% market share despite slower growth.
- Mopeds exhibited steady performance, recording 4.2% growth and maintaining niche appeal.
2. Company-Wise Market Share Analysis: The Complete Picture
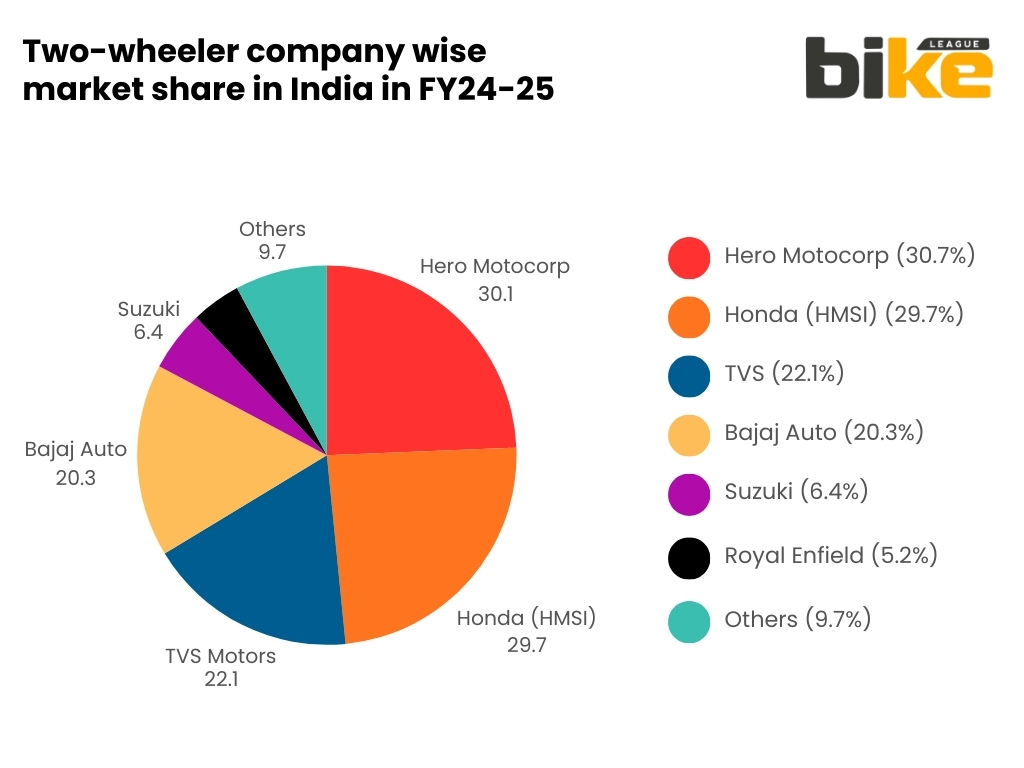
1. Overall Market Leadership – FY 2024-25
Based on comprehensive data from SIAM, FADA (Federation of Automobile Dealers Associations), and company disclosures, here’s the detailed company-wise breakdown. Furthermore, this comparison provides a holistic view of the competitive landscape:
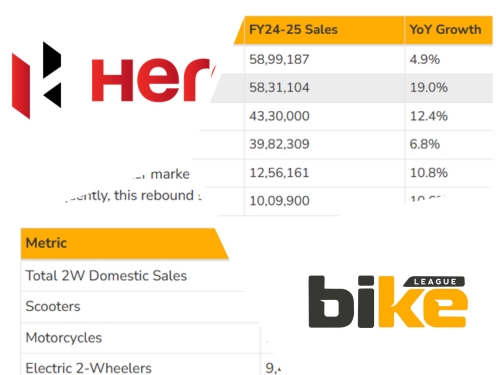
| Company | FY23-24 Sales | FY24-25 Sales | YoY Growth | FY24-25 Share |
|---|---|---|---|---|
| Hero MotoCorp | 56,21,455 | 58,99,187 | 4.9% | 30.1% |
| Honda (HMSI) | 48,93,522 | 58,31,104 | 19.0% | 29.7% |
| TVS Motor | 38,51,000 | 43,30,000 | 12.4% | 22.1% |
| Bajaj Auto | 37,27,923 | 39,82,309 | 6.8% | 20.3% |
| Suzuki Motorcycle | 11,33,902 | 12,56,161 | 10.8% | 6.4% |
| Royal Enfield | 9,12,732 | 10,09,900 | 10.6% | 5.2% |
| Others | 17,74,831 | 18,99,671 | 7.0% | 9.7% |
| Total | 1,79,74,365 | 1,96,07,332 | 9.1% | 100% |
Table 2: Company-Wise Two-Wheeler Sales and Market Share – FY24-25
Note: Market share percentages calculated based on domestic sales. TVS figures represent two-wheeler sales only, excluding three-wheelers.
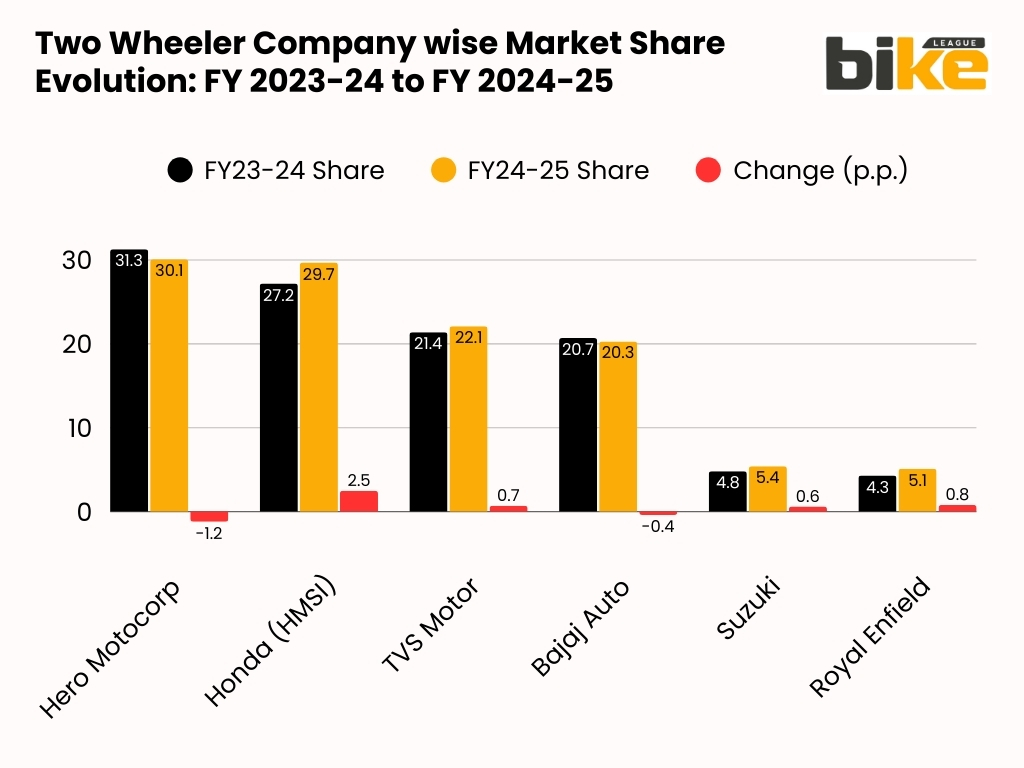
2. Market Share Evolution: FY 2023-24 to FY 2024-25
As a result, the competitive landscape shifted significantly during FY 2024-25:
| Company | FY23-24 Share | FY24-25 Share | Change (p.p.) |
|---|---|---|---|
| Hero MotoCorp | 31.3% | 30.1% | -1.2 |
| Honda (HMSI) | 27.2% | 29.7% | +2.5 |
| TVS Motor | 21.4% | 22.1% | +0.7 |
| Bajaj Auto | 20.7% | 20.3% | -0.4 |
| Suzuki | 4.8% | 5.4% | +0.6 |
| Royal Enfield | 4.3% | 5.1% | +0.8 |
Table 3: Market Share Evolution – Percentage Point Changes
Critical Insights
- Honda’s Aggressive Expansion: Honda expanded quickly, gaining 2.5 percentage points—the biggest increase among major manufacturers. Strong sales of the Activa scooter and Shine motorcycle, along with a focus on scooters and urban markets, helped Honda reach almost 30% market share.
- Hero’s Gradual Decline: Hero stayed on top but lost 1.2 percentage points, growing slower than the overall market. This drop is due to tough competition in the commuter segment and slower adoption of premium models, although the Splendor still sells well in rural areas.
- TVS Steady Climb: TVS grew steadily, gaining 0.7 percentage points thanks to a balanced mix of motorcycles, scooters, and electric vehicles. The company saw strong results from NTorq and Jupiter scooters, Apache bikes, and its leading iQube electric scooter.
- Bajaj Stability: Bajaj maintained its market share, even as domestic growth was slow. Strong exports, which accounted for 42% of its sales, helped offset a 0.4 percentage point drop at home, underscoring the company’s strength in international markets.
- Suzuki’s Scooter Surge: Suzuki increased its share by 0.6 percentage points to 5.4%, with a record 12.56 lakh units sold and 14% year-on-year growth. The Access 125 scooter led this growth, as Suzuki doubled its sales in four years by focusing on urban scooters.
- Royal Enfield’s Premium Power: Royal Enfield saw the fastest growth, gaining 0.8 percentage points and selling over 1 million bikes in India. The 650cc twins (Continental GT and Interceptor) and the Classic 350 led the premium segment, giving RE 96% of the 500-800cc market and making it the country’s fastest-growing legacy motorcycle brand.
3. Detailed Company Performance Analysis
1. Hero MotoCorp – Market Leader Under Pressure
Market Position
#1 in India, 24th consecutive year as retail leader
| Metric | FY 2023-24 | FY 2024-25 | Growth % |
|---|---|---|---|
| Total 2W Sales | 56,21,455 | 58,99,187 | 4.9% |
| Domestic Sales | 54,20,532 | 56,11,758 | 3.5% |
| Exports | 2,00,923 | 2,87,429 | 43.0% |
Table 3: Hero MotoCorp Performance Metrics
Strengths
- Widest distribution network: 2,600+ dealers and outlets across India
- Dominant in the 100-125cc commuter segment (Splendor, HF Deluxe)
- Strong rural market penetration
- Export growth of 43% indicates successful diversification.
Challenges
- Growth rate (4.9%) is significantly below the industry average (9.1%)
- Losing market share in urban scooters and premium motorcycles
- Limited traction in the electric two-wheeler segment
- Facing intense competition from Honda and TVS in key segments
Strategic Imperatives
- Accelerate electric vehicle product launches.
- Strengthen premium motorcycle portfolio.
- Enhance urban scooter offerings.
- Leverage the Harley-Davidson partnership to enter the premium segment.
2. Honda Motorcycle & Scooter India (HMSI) – The Big Winner
Market Position
#2 in India, Fastest major gainer in FY24-25
| Metric | FY 2023-24 | FY 2024-25 | Growth % |
|---|---|---|---|
| Total 2W Sales | 56,21,455 | 58,99,187 | 4.9% |
| Domestic Sales | 54,20,532 | 56,11,758 | 3.5% |
| Exports | 2,00,923 | 2,87,429 | 43.0% |
Table 4: Honda Performance Metrics
Success Factors
- Scooter Dominance: Activa led the segment, achieving 17.4% growth.
- Network Expansion: 6,500+ touchpoints, including RedWing (mass market), BigWing (premium), Best Deal (used vehicles), and e:Swap stations
- Product Portfolio: Strong presence across segments:
1. Mass scooters: Activa, Dio
2. Commuter motorcycles: Shine, SP 125
3. Premium: BigWing lineup - Technology Leadership: Launched Activa e, showcased flex-fuel technology, battery swapping infrastructure
Growth Drivers
- 19% growth rate – more than double the industry average
- Captured a significant share from Hero in urban markets
- Export volumes exceeded 5 lakh units.
- Balanced ICE and EV strategy
3. TVS Motor Company – Balanced Growth Machine
Market Position
#3 in India, Strong in motorcycles, scooters, and EVs
| Metric | FY 2023-24 | FY 2024-25 | Growth % |
|---|---|---|---|
| Total 2W Sales | 38,51,000 | 43,30,000 | 12.4% |
| Domestic Sales (est.) | 31,51,000 | 35,30,000 | 12.0% |
| Exports (est.) | 7,00,000 | 8,00,000 | 14.3% |
Table 5: TVS Motor Performance Metrics
Portfolio Strengths
- Motorcycles: Apache series, Raider, Sport
- Scooters: Jupiter, NTorq, Scooty
- Electric: iQube EV – fastest-growing EV among legacy OEMs
- Exports: Strong presence in Africa and Latin America
Competitive Advantages
- Diversified product mix across segments
- Strong rural and semi-urban presence
- Leading EV position among traditional OEMs
- Export growth of 18%, enhancing scale and margins.
- iQube sales jumped 77% in March 2025 alone
Calendar Year 2025 Performance: TVS emerged as #1 in December 2025 total sales (domestic + exports) with 4,61,071 units, surpassing both Hero and Honda
4. Bajaj Auto – Export-Focused Strategy
Market Position
#4 in India, #1 in two-wheeler exports
| Metric | FY 2023-24 | FY 2024-25 | Growth % |
|---|---|---|---|
| Total 2W Sales | 37,27,923 | 39,82,309 | 6.8% |
| Domestic 2W | 22,50,585 | 23,08,249 | 2.6% |
| Export 2W | 14,77,338 | 16,74,060 | 13.3% |
Table 6: Bajaj Auto Performance Metrics
Business Model Characteristics
- Export-Heavy Portfolio: Over 42% of two-wheeler volumes exported, the highest among major OEMs
- Product Focus: 1. Pulsar range (100cc to 250cc)
2. Platina commuter motorcycles
3. Chetak electric scooter - Geographic Diversification: Strong presence in Africa, Latin America, and Southeast Asia
- Electric Transition: Chetak sales momentum is making Bajaj a top electric two-wheeler brand
Strategic Position
- Slower domestic growth (2.6%) compensated by robust export growth (13.3%)
- Less vulnerable to domestic market cyclicality
- Calendar Year 2025: Bajaj overtook Ola Electric in EV sales with 2,66,919 units
5. Suzuki Motorcycle India – Fast-Growing Mid-Size Player
Market Position
#5 in India, Rapid expansion from niche player
| Metric | FY 2023-24 | FY 2024-25 | Growth % |
|---|---|---|---|
| Total 2W Sales | 11,33,902 | 12,56,161 | 10.8% |
| Domestic Sales | 9,21,009 | 10,45,662 | 13.5% |
| Exports | 2,12,893 | 2,10,499 | -1.1% |
Table 7: Suzuki Motorcycle Performance Metrics
Growth Story
- Scooter Success: Access 125, Burgman Street, Avenis driving urban sales
- Motorcycle Portfolio: Gixxer series gaining traction
- Domestic Focus: 13.5% domestic growth, second only to Honda among major OEMs
- Urban Positioning: Strong presence in metropolitan and tier-1 cities
Key Achievements
- Sales volume more than doubled from FY 2020-21 levels.
- Consistent market share gains over the past 4 years
- Well-positioned in the scooter growth wave
- Building a foundation for electric vehicle entry
6. Royal Enfield – Premium Segment Leader
Market Position
#6 overall, #1 in 250cc+ segment with ~95% share
| Metric | FY 2023-24 | FY 2024-25 | Growth % |
|---|---|---|---|
| Total 2W Sales | 9,12,732 | 10,09,900 | 10.6% |
| Domestic Sales | 8,34,795 | 9,02,757 | 8.1% |
| Exports | 77,937 | 1,07,143 | 37.5% |
Table 8: Royal Enfield Performance Metrics
Niche Dominance Strategy
- Segment Focus: Exclusive focus on 250-750cc motorcycles
- Brand Strength: Classic 350, Bullet, Hunter 350, Meteor 350, commanding loyalty.
- Premium Expansion: Himalayan 450, 650cc twins (Interceptor, Continental GT, Super Meteor) attracting enthusiasts
- Export Growth: 37.5% export growth, indicating global brand appeal
- Million-Unit Club: Crossed 1 million annual sales milestone
Unique Position: Only major OEM not competing in mass market, insulated from mainstream competition
4. Electric two-wheeler company wise market share in India in FY24-25
1. EV Segment Growth and Market Leaders
Notably, electric two-wheelers became a key growth area in FY 2024-25, with sales reaching 11.49 lakh units, a 21% increase from the previous year.
| Company | FY23-24 Sales | FY24-25 Sales (est.) | Market Share |
|---|---|---|---|
| Ola Electric | 3,26,443 | 3,44,009 | 29.9% |
| TVS Motor (iQube) | 1,82,959 | 2,95,315 | 25.7% |
| Bajaj Auto (Chetak) | 1,06,994 | 2,66,919 | 23.2% |
| Ather Energy | 1,08,872 | 1,55,394 | 13.5% |
Table 9: Electric Two-Wheeler Market Share – FY24-25
Note: Based on data from SMEV (Society of Manufacturers of Electric Vehicles), company disclosures, and VAHAN registration data.
2. EV Market Dynamics – Key Developments
Leadership Changes in Calendar Year 2025
- TVS overtook Ola Electric with 2,95,315 units vs. Ola’s 1,96,767 units in CY2025
- Bajaj Chetak recorded 2,66,919 units, securing #2 position
- Ola Electric’s monthly registrations became volatile in late 2024 and 2025
- Legacy OEMs (TVS, Bajaj, Hero) gained at the expense of EV-only startups
Growth Drivers
- Government Support: FAME-II and successor schemes, GST differential (5% for EVs vs 28% for ICE)
- Infrastructure Development: Charging and battery swapping networks are expanding
- Product Innovation: Longer range, faster charging, connected features
- Legacy OEM Entry: Hero (Vida), Honda (Activa e:), Bajaj (Chetak), bringing credibility
Challenges
- After-sales service quality concerns for EV-only brands
- Battery safety and standardisation issues
- Price sensitivity despite subsidies
- Charging infrastructure gaps in tier-2/3 cities
5. Retail vs Wholesale Market Share Analysis
Retail market share, based on FADA data, differs from wholesale figures and offers a clearer picture of real demand:
| Company | Wholesale Share FY24-25 | Retail Share FY24-25 |
|---|---|---|
| Hero MotoCorp | 30.1% | 28.84% |
| Honda (HMSI) | 29.7% | 25.37% |
| TVS Motor | 22.1% | 17.49% |
| Bajaj Auto | 20.3% | 11.41% |
Table 10: Wholesale vs Retail Market Share Comparison
Key Observations
- Hero’s Retail Strength: Despite wholesale share erosion, Hero maintains a stronger retail presence due to its extensive dealer network
- Honda’s Wholesale Lead: A higher wholesale share indicates aggressive inventory build-up and export push.
- TVS Export Impact: Lower retail share reflects a significant export component (18-20% of volumes)
- Bajaj Export Dominance: Massive gap between wholesale (20.3%) and retail (12.22%) confirms export-heavy strategy (42% exports)
6. Export Market Share Analysis
In addition, India exported about 42 lakh two-wheelers in FY 2024-25, a 21.4% increase over the previous year.
| Company | FY23-24 Exports | FY24-25 Exports | Export Share |
|---|---|---|---|
| Bajaj Auto | 14,77,338 | 16,74,060 | 39.9% |
| TVS Motor | 7,00,000 (est.) | 8,00,000 (est.) | 19.0% |
| Honda (HMSI) | 5,00,000 (est.) | 5,00,000+ | 11.9% |
| Hero MotoCorp | 2,00,923 | 2,87,429 | 6.8% |
Table 11: Company-Wise Export Market Share
Export Insights
- Bajaj Dominance: Commands 40% export share, highest among all OEMs
- TVS Global Presence: 19% share with strong Africa and Latin America presence
- Hero’s Export Push: 43% export growth indicates aggressive overseas expansion
- Royal Enfield Global Brand: 37.5% export growth reflects international demand for premium motorcycles
- Regional Focus: Africa (recovery), Latin America (steady), Southeast Asia (emerging)
7. Factors Driving Market Share Changes
1. Product Portfolio Strength
Winners
- Honda: Activa scooter dominance + Shine motorcycle success
- TVS: Balanced portfolio (Jupiter, NTorq, Apache, Raider, iQube EV)
- Suzuki: Urban scooter focus (Access, Burgman) aligned with segment growth
Challenged
- Hero: Heavy dependence on 100-125cc commuters, weak in scooters and EVs
- Bajaj: Limited scooter presence (only Chetak EV), motorcycle-focused
2. Distribution Network Expansion
| Company | Touchpoints | Network Strategy |
|---|---|---|
| Hero MotoCorp | 2,600+ dealers | Wide rural penetration |
| Honda (HMSI) | 6,500+ touchpoints | Multi-format: RedWing, BigWing |
| TVS Motor | 4,000+ outlets | Balanced urban-rural |
| Bajaj Auto | 3,000+ dealers | Export-focused |
Table 12: Distribution Network Comparison
Network Impact on Market Share
- Honda’s 6,500+ touchpoint expansion directly correlated with a 2.5 percentage point market share gain.
- Hero’s traditional network maintained leadership, but was insufficient for growth.
- TVS’s balanced approach supporting steady share gains
- Royal Enfield’s studio model is effective for premium positioning.
3. Scooter vs Motorcycle Portfolio Mix
With scooters growing 17.4% vs. motorcycles at 5.1%, the portfolio mix became critical:
| Company | Scooter Strength | Motorcycle Strength | Impact |
|---|---|---|---|
| Honda | Very High | Moderate | Benefited massively |
| TVS | High | High | Balanced advantage |
| Hero | Low | Very High | Growth constrained |
Table 13: Portfolio Mix Impact on Market Share
4. Electric Vehicle Strategy
- TVS: Market leader with iQube, integrated ICE-EV strategy
- Bajaj: Chetak revival successful, climbing to #2 in EV sales
- Hero: Vida V2 launched but with a slower ramp-up (48,674 retail units in FY25)
- Honda: Activa e: launched late FY25, building momentum
- Suzuki: Yet to launch electric offering, planning stage
- Royal Enfield: Exploring the electric segment, not yet launched
EV Impact: TVS and Bajaj gained a competitive advantage through early EV leadership, while Hero’s delayed entry impacted overall market position.
5. Pricing and Value Proposition
- Premium Positioning: Royal Enfield, Honda BigWing successfully capture the willingness to pay more
- Value Leadership: Hero, Bajaj, maintaining price competitiveness in the mass market
- Feature-Rich Mid-Segment: TVS, Honda, balancing features and affordability
- Urban Premium Scooters: Honda Activa, TVS NTorq commanding premiums over competition
6. After-Sales Service and Customer Satisfaction
- Service Network Density: Hero and Honda lead with the most service centres.
- Parts Availability: Wide networks ensure faster repairs, critical for fleet operators
- Warranty Programs: Extended warranties and free service packages influence choices
- Customer Satisfaction: JD Power and other surveys show Honda and TVS leading in urban markets
8. Segment-Specific Market Share Analysis
1. Scooter Segment Market Share
Scooters totalled 68,53,214 units in FY 2024-25 (35% of the total market):
| Company | Scooter Market Share (Est.) |
|---|---|
| Honda (HMSI) | 38-40% |
| TVS Motor | 22-24% |
| Suzuki | 12-14% |
Table 14: Estimated Scooter Segment Market Share – FY24-25
Scooter Leaders: Honda Activa commands approximately 25-30% of the total scooter market, making it the single-largest two-wheeler model in India.
2. Motorcycle Segment Market Share
Motorcycles totalled 1,22,52,305 units in FY 2024-25 (62.5% of the total market):
| Company | Motorcycle Share (Est.) |
|---|---|
| Hero MotoCorp | 35-37% |
| Bajaj Auto | 24-26% |
| TVS Motor | 18-20% |
Table 15: Estimated Motorcycle Segment Market Share – FY24-25
Motorcycle Leaders: Hero Splendor remains India’s best-selling motorcycle, followed by the Bajaj Pulsar range and the TVS Apache series.
3. Premium Motorcycle Segment (250cc+)
| Company | Premium Share (250cc+) |
|---|---|
| Royal Enfield | 85-95% |
| Bajaj | 3-5% |
| TVS | 1-2% |
Table 16: Premium Motorcycle Segment Market Share
Royal Enfield Dominance: Near-monopoly in the 250- 350cc segment, expanding into 450cc and 650cc segments with new launches.
9. Market Share Stability and Volatility Analysis
1. Historical Market Share Trends (FY 2021-2025)
| Company | FY21 | FY22 | FY23 | FY24 | FY25 |
|---|---|---|---|---|---|
| Hero MotoCorp | 37% | 35% | 33% | 31.3% | 30.1% |
| Honda (HMSI) | 26% | 26% | 27% | 27.2% | 29.7% |
| TVS Motor | 14% | 15% | 17% | 21.4% | 22.1% |
| Bajaj Auto | 12% | 13% | 13% | 20.7% | 20.3% |
Table 17: Market Share Evolution (FY 2021-2025)
Note: Data compiled from multiple sources, including company reports, FADA, and industry analysis.
Key Trends
- Hero’s Steady Decline: Lost 6.9 percentage points over 4 years (37% to 30.1%)
- Honda’s Gradual Gain: Gained 3.7 percentage points (26% to 29.7%)
- TVS Impressive Growth: Gained 8.1 percentage points (14% to 22.1%)
- Bajaj Sharp Jump: FY23 to FY24 saw a significant methodology change in reporting
2. Market Share Volatility Index
Stability Ranking (Lower volatility = Higher stability)
- Honda (HMSI) – Most stable, gradual growth
- Hero MotoCorp – Stable decline, predictable
- Bajaj Auto – Moderate volatility, export-dependent
- Suzuki Motorcycle – Moderate, growth phase
- Royal Enfield – Moderate, niche stability
- TVS Motor – Higher volatility due to rapid growth
- EV Brands – Highest volatility, nascent market
Implications
- Honda offers predictability for planning and investment.
- Hero’s decline stabilising, finding a new equilibrium.
- TVS growth is creating opportunities and challenges
- EV brands are facing the highest uncertainty.
10. Dealer and Distribution Network Analysis
1. Network Density Comparison
| Company | Dealers/Touchpoints | Service Centers | Coverage |
|---|---|---|---|
| Hero MotoCorp | 2,600+ | 5,000+ | Pan-India, rural strong |
| Honda (HMSI) | 6,500+ | 4,500+ | Pan-India, multi-format |
| TVS Motor | 4,000+ | 3,500+ | Pan-India, balanced |
Table 18: Distribution Network Comparison
2. Network Effectiveness
- Honda – Highest touchpoint count driving market share gains
- Hero – High dealer density but traditional format limiting growth
- TVS – Balanced network supporting steady expansion
- Bajaj – Lower domestic density offset by export focus
3. Service Quality and Customer Satisfaction
JD Power India Customer Service Index (CSI) Rankings (Industry Reports):
- Honda (HMSI) – Highest satisfaction
- TVS Motor – Strong performance
- Hero MotoCorp – Moderate satisfaction
- Bajaj Auto – Moderate satisfaction
- Suzuki – Improving
4. Service Impact on Market Share
- Honda’s service excellence is driving repeat purchases and referrals.
- TVS leveraging satisfaction for premium product sales
- Hero’s traditional service model is adequate for the commuter segment.
- EV brands are facing service-quality challenges that are affecting growth.
5. Digital Transformation in Distribution
Online Sales and Digital Touchpoints
- Hero: Digital showrooms, online booking
- Honda: Virtual showrooms, configurators
- TVS: E-commerce integration, digital marketing
- Bajaj: Online Chetak bookings, digital-first approach
- Ola: Direct-to-consumer model, app-based
Impact
- Reducing dealer dependency for initial engagement
- Improving customer experience and reducing friction
- Data collection for personalisation
- Cost optimisation in distribution
FAQ about Two-wheeler Company wise Market Share in India in FY24-25
1. What are the major trends shaping India’s two-wheeler market in FY 2024-25?
The key trends include the rise of electric vehicles, urbanisation, evolving consumer preferences, regulatory changes, and increased competition among established and new players.
2. Which companies gained the most market share this year?
Honda (HMSI) achieved the largest market share gain, driven by strong scooter sales and network expansion.
3. How are legacy brands responding to the electric vehicle (EV) transition?
Legacy brands like TVS and Bajaj are investing in EV development, launching competitive models, and leveraging their existing dealer networks to gain an edge over new entrants.
4. What factors have contributed to the success of Bajaj and TVS in exports?
Robust export strategies, diverse international markets, and strong brand recognition have helped Bajaj and TVS maintain stable growth despite domestic fluctuations.
5. Why is the scooter segment experiencing rapid growth?
The scooter segment is growing due to increasing demand for urban mobility solutions, convenience, and the popularity of models from Honda, TVS, and Suzuki.
6. What are the challenges faced by Hero MotoCorp?
Hero MotoCorp is facing market-share erosion due to slower growth in the scooter and EV segments, underscoring the need for innovation and diversification.
7. How are regulatory norms affecting the industry?
Changing regulatory norms, such as stricter emission standards and EV incentives, are pushing manufacturers to adapt and innovate.
8. What is the outlook for electric two-wheelers in India?
The outlook is positive, with increasing adoption, policy support, and investments by both legacy and new brands driving rapid growth in the EV segment.
9. How do sales data and segment dynamics influence market strategy?
Sales data helps companies identify growth areas, while analysing segment dynamics allows them to tailor products and marketing strategies to evolving consumer needs.
10. Who can benefit from this market analysis?
Industry stakeholders, investors, policymakers, and business strategists can leverage this analysis to inform decisions on the evolving two-wheeler landscape in India.
Other Related Links from Bikeleague India
- Two wheeler Sales in India FY 2023-24 | Analysis of Top Brands
- Top 10 bike / scooter brands as per India’s market share
- TVS Motors Growth: Unprecedented Two-Wheeler Story FY21-25
- Two wheeler sales in India in FY 24-25 | Analysis of Top Brands
- Two-Wheeler Brand Preferences in India
References
- Society of Indian Automobile Manufacturers (SIAM). (2025, April 14). Auto Industry Performance of March 2025 and April 2024. Press Release. https://www.siam.in/pressrelease-details.aspx?mpgid=48&pgidtrail=50&pid=579
- Society of Indian Automobile Manufacturers (SIAM). (2025, July 14). Key Highlights from Q1 (April–June 2025). https://www.siam.in/pressrelease-details.aspx?mpgid=48&pgidtrail=50&pid=583
- Society of Manufacturers of Electric Vehicles (SMEV). (2024, October 21). FY 2024-2025 Electric Two-Wheeler Sales Data. https://www.smev.in/fy-24-25
- Statista. (2024, September 29). India: two-wheeler domestic sales 2024. https://www.statista.com/statistics/318023/two-wheeler-sales-in-india/
- Society of Indian Automobile Manufacturers (SIAM). (2025, April 14). Press Releases – Two-Wheeler Segment Performance FY 2024-25. https://www.siam.in/pressrelease-details.aspx?mpgid=48&pgidtrail=50&pid=579
Conclusion
Overall, the Indian two-wheeler market’s FY 2024-25 performance revealed a dynamic competitive landscape undergoing significant transformation. With overall industry growth of 9.1% reaching 1.96 crore units, the market demonstrated robust recovery, approaching pre-pandemic peaks. Key observations are
- Honda (HMSI) emerged as the Biggest Winner: Gaining 2.5 percentage points to reach 29.7% market share, driven by Activa scooter dominance, aggressive network expansion (6,500+ touchpoints), and 19% year-on-year growth.
- Hero MotoCorp Faces Challenges: Despite maintaining leadership at 30.1% share, Hero lost 1.2 percentage points, growing only 4.9% compared to the 9.1% industry average, constrained by a limited scooter portfolio and a slower EV transition.
- TVS Motor’s Balanced Excellence: Gained 0.7 percentage points to 22.1% share through diversified portfolio (motorcycles, scooters, iQube EV), 12% growth rate, and leadership in electric two-wheelers among legacy OEMs.
- Bajaj Auto’s Export-Focused Stability: Maintained 20.3% share through export dominance (42% of volumes), Chetak EV success (overtaking Ola in CY2025), though domestic growth lagged at 2.6%.
- Suzuki and Royal Enfield Steady Growth: Both maintained stable positions with 10%+ growth rates; Suzuki benefited from the scooter segment boom, while Royal Enfield commanded 95% of the 250cc+ segment.
Structural Market Shifts
- Scooters are growing 17.4% vs. motorcycles at 5.1%, benefiting Honda, TVS, and Suzuki.
- Electric vehicles crossing 6% threshold with 21% growth, TVS and Bajaj gaining a competitive advantage.
- Exports surging 21.4% to 42 lakh units, reducing domestic dependency.
- Rural demand recovery supporting Hero and TVS, urban growth favouring Honda and Suzuki.
Looking Ahead to FY 2025-26
Looking ahead, Honda and TVS are likely to keep gaining market share unless Hero accelerates its scooter and EV plans. The two wheeler sales statistics in India in FY24-25 indicate that electric vehicles will play an increasingly important role in shaping the market. Established companies will need to perform well in EVs to remain leaders. Export markets are expected to support growth, and a strong dealer network will continue to set companies apart.
For OEMs, dealers, investors, and policymakers, the shifts in market share during FY 2024-25 show the importance of having a balanced product range, preparing for electric vehicles, building strong distribution networks, and quickly adapting to customer needs. The two-wheeler industry is at a turning point, and companies must blend their traditional strengths with new skills to lead the market going forward.
If you have any questions about the Two-wheeler Company wise Market Share in India in FY24-25, you can email us at bikeleague2017@gmail.com or leave a comment below. We’re here to help. You can also reach out to Bikeleague India on social media.